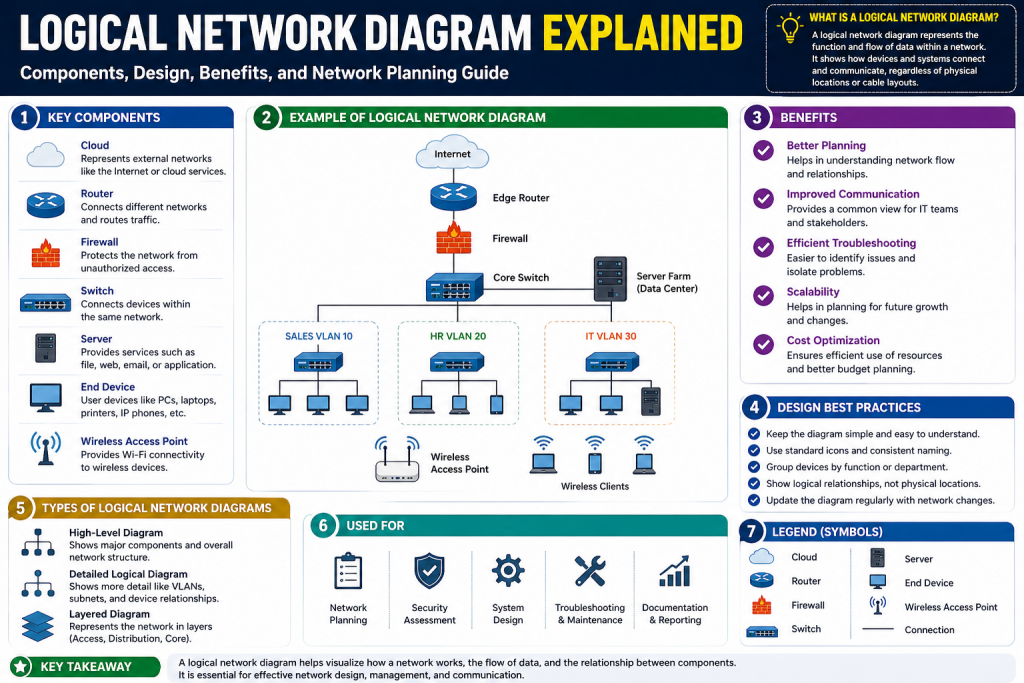
Network environments today are more complex than ever before, and with that complexity comes a growing need for clear and reliable documentation. One of the most common frustrations for IT professionals is stepping into a network environment where little to no documentation exists. Without a proper reference, understanding how systems connect, how traffic flows, and why certain configurations were implemented becomes unnecessarily difficult. This lack of clarity can slow down operations, increase the risk of errors, and make troubleshooting far more time-consuming than it needs to be.
A logical network diagram is designed to solve this exact problem. It provides a structured and simplified way to visualize a network from a functional perspective. Instead of focusing on cables, hardware placement, or physical layouts, it highlights how devices communicate and how data travels across the network. This makes it an essential tool for anyone responsible for managing, maintaining, or designing network systems.
In any professional environment, documentation is not just helpful—it is critical. Among all forms of documentation, logical network diagrams stand out because they provide a high-level overview that is both practical and easy to understand. They allow network administrators to quickly identify relationships between devices, understand traffic paths, and gain insight into how the network is intended to operate. Without such a diagram, even routine tasks can become unnecessarily complicated.
What is a Logical Network Diagram
A logical network diagram is a visual representation that illustrates how devices, systems, and subnets interact within a network. It focuses on the logical relationships between components rather than their physical arrangement. This means it shows how data flows, which devices process or route traffic, and how different parts of the network are structured and connected.
Unlike a physical diagram, which might show racks, cables, and hardware placement, a logical diagram removes those details and instead emphasizes functionality. It answers important questions such as how devices communicate with each other, which paths data follows, and how network segments are organized. This abstraction makes it easier to understand the network without being overwhelmed by unnecessary details.
Logical network diagrams can vary in complexity depending on the size and needs of the network. In smaller environments, they may include only a few devices and connections. In larger and more complex networks, they can include multiple layers, routing paths, security zones, and detailed annotations. Regardless of complexity, the goal remains the same: to provide a clear and accurate representation of how the network operates.
Another important aspect of logical diagrams is flexibility. They can be adapted to suit different audiences and purposes. For example, a high-level diagram might be used for presentations or planning, while a more detailed version might be used for troubleshooting or configuration management. This adaptability makes logical diagrams a versatile and valuable tool.
The Difference Between Logical and Physical Network Diagrams
To fully understand the importance of logical network diagrams, it is helpful to compare them with physical network diagrams. Both types of diagrams are essential, but they serve different purposes and provide different types of information.
A physical network diagram focuses on the tangible aspects of a network. It shows where devices are located, how they are connected with cables, and how the infrastructure is physically arranged. This type of diagram is particularly useful for installation, maintenance, and hardware troubleshooting. It helps technicians understand how to physically interact with the network components.
On the other hand, a logical network diagram focuses on how the network functions. It illustrates communication paths, IP addressing schemes, and the relationships between devices. It does not concern itself with where devices are located or how they are physically connected. Instead, it provides a conceptual view of the network’s operation.
For example, if a network administrator needs to troubleshoot a connectivity issue, a logical diagram can help identify the expected path of the data and where it might be failing. A physical diagram, in contrast, would be more useful if the issue involved a broken cable or a malfunctioning piece of hardware.
These two types of diagrams complement each other. A well-documented network typically includes both logical and physical diagrams, allowing administrators to view the network from different perspectives. This combination provides a more complete understanding and supports more effective management.
Why Logical Network Diagrams Are Essential
Logical network diagrams play a critical role in the effective management of networks. They provide a reference point that helps administrators understand what is supposed to happen within the network. This is especially important when diagnosing problems, planning changes, or onboarding new team members.
One of the primary benefits of a logical diagram is clarity. Networks can become highly complex, with multiple devices, subnets, and routing paths. A logical diagram simplifies this complexity by presenting only the most relevant information in a structured and easy-to-understand format. This makes it easier to identify relationships and understand how different components interact.
Another key benefit is consistency. When a network is properly documented, administrators can rely on the diagram to understand configurations and relationships. This reduces the likelihood of mistakes and ensures that everyone working on the network has a shared understanding of its structure.
Logical diagrams also improve communication. When discussing network changes or troubleshooting issues, it is much easier to explain concepts using a visual representation. This is particularly helpful when working with team members who may not be familiar with every detail of the network.
In addition, logical diagrams support better planning and decision-making. Whether expanding the network, adding new devices, or implementing new services, having a clear understanding of the existing structure is essential. A logical diagram provides the foundation needed to make informed decisions and avoid potential issues.
Core Elements Found in a Logical Network Diagram
A logical network diagram is made up of several key components that together provide a comprehensive view of the network. While the specific elements may vary depending on the environment, there are certain core components that are commonly included.
Devices are one of the most important elements. These include routers, firewalls, servers, and other systems that process or direct traffic. Each device is represented in a way that clearly shows its role within the network.
Subnets and network segments are also essential. These define how the network is divided and how different groups of devices communicate with each other. Including this information helps illustrate the structure of the network and how traffic flows between segments.
Connections between devices represent the logical paths that data takes as it moves through the network. These connections may include information about routing protocols, bandwidth, or other relevant details.
Traffic flow is often highlighted to show how data moves from one point to another. This can be particularly useful for understanding application behavior or identifying potential bottlenecks.
Security components are another important aspect. Firewalls, authentication servers, and access control systems play a critical role in modern networks. Representing these elements in the diagram helps clarify how security is implemented and how traffic is controlled.
Finally, annotations and labels provide additional context. These may include IP addresses, VLAN identifiers, or notes about specific configurations. While the diagram itself should remain clean and readable, these details ensure that important information is not overlooked.
The Importance of Keeping Diagrams Updated
Creating a logical network diagram is only part of the process. Keeping it accurate and up to date is equally important. A diagram that does not reflect the current state of the network can lead to confusion and mistakes.
Networks are constantly evolving. Devices are added or removed, configurations are changed, and new services are introduced. Each of these changes should be reflected in the logical diagram. Failing to update the diagram can result in outdated information that misleads administrators.
For example, if a diagram shows a connection that no longer exists, an administrator might waste time troubleshooting an issue based on incorrect assumptions. Similarly, if a new device is not included, its role in the network may be misunderstood.
Regular updates ensure that the diagram remains a reliable source of information. This requires a disciplined approach to documentation, where every significant change is followed by an update to the diagram.
It is also important to establish standards for how diagrams are created and maintained. Consistent use of symbols, labels, and formatting makes diagrams easier to read and understand. This is especially important in environments where multiple people are responsible for managing the network.
How Logical Diagrams Support Troubleshooting
Troubleshooting is one of the areas where logical network diagrams provide the most value. When something goes wrong in a network, the first step is to understand what is supposed to happen. A logical diagram provides this baseline.
By comparing the expected behavior shown in the diagram with the actual behavior observed in the network, administrators can identify discrepancies. These discrepancies often point directly to the source of the problem.
For instance, if traffic is not reaching a particular server, the logical diagram can be used to trace the expected path. Each step along the path can then be tested to determine where the issue occurs. This structured approach makes troubleshooting more efficient and reduces guesswork.
Logical diagrams also help identify dependencies between systems. In many networks, services rely on multiple components to function properly. If one component fails, it can affect several others. Understanding these relationships is essential for diagnosing complex issues.
In addition, logical diagrams can be used to evaluate the impact of changes before they are implemented. By analyzing the diagram, administrators can predict how modifications will affect traffic flow and identify potential risks. This helps ensure smoother implementations and reduces the likelihood of unexpected problems.
Building a Strong Understanding of Network Structure
A logical network diagram is more than just a visual tool—it is a foundation for understanding how a network operates. By focusing on relationships, data flow, and functionality, it provides a clear and concise view of the network’s structure.
This understanding is essential for effective network management. Whether troubleshooting issues, planning upgrades, or training new team members, having a reliable reference makes all the difference. Logical diagrams bridge the gap between complexity and clarity, allowing administrators to navigate their networks with confidence.
As networks continue to grow in size and complexity, the importance of logical diagrams will only increase. They provide a way to manage that complexity, ensuring that networks remain organized, efficient, and easy to understand.
Exploring the Key Components of a Logical Network Diagram
A logical network diagram becomes truly useful when it includes all the essential components that define how a network operates. While the concept itself is straightforward, the effectiveness of the diagram depends heavily on how well these components are identified, organized, and presented. A well-constructed diagram should provide enough detail to understand the network’s behavior without overwhelming the viewer with unnecessary complexity.
At the center of every logical diagram are the devices that make up the network. These include routers, firewalls, servers, and other systems responsible for directing or processing data. Each device plays a specific role, and representing those roles clearly is critical. For example, routers handle traffic between networks, firewalls enforce security policies, and servers provide services such as web hosting or authentication. When these devices are properly labeled and positioned, the diagram becomes much easier to interpret.
Another important component is the network segmentation. Modern networks are rarely flat; instead, they are divided into multiple subnets or segments to improve performance, security, and manageability. A logical diagram should clearly show these segments and how they relate to one another. This includes identifying boundaries between internal networks, external connections, and specialized zones such as guest networks or secure environments.
Connections between devices are equally important. These connections represent the logical pathways that data follows as it travels through the network. Unlike physical diagrams, these connections do not necessarily reflect actual cables. Instead, they illustrate communication paths, routing relationships, and data flow. Properly representing these connections helps administrators understand how traffic moves and where potential bottlenecks or failures might occur.
Understanding Network Segmentation and Subnetting
Network segmentation is a fundamental concept in logical network design. It involves dividing a network into smaller, more manageable sections, each with its own purpose and characteristics. These sections, often referred to as subnets, help control traffic flow, improve security, and optimize performance.
In a logical network diagram, subnets are typically represented as distinct areas or zones. Each subnet may contain specific types of devices or serve a particular function. For example, one subnet might be dedicated to user devices, while another hosts servers or critical infrastructure. By visually separating these segments, the diagram makes it easier to understand how the network is organized.
Subnetting also plays a key role in IP address management. Each subnet is assigned a range of IP addresses, which helps ensure efficient use of available resources. Including subnet information in the diagram allows administrators to quickly identify which devices belong to which segment and how addressing is structured.
Another advantage of segmentation is improved security. By isolating different parts of the network, administrators can apply specific security policies to each segment. For instance, sensitive systems can be placed in a restricted subnet with limited access, while less critical systems may reside in a more open environment. Representing these boundaries in the diagram helps clarify how security measures are implemented.
Segmentation also enhances performance by reducing unnecessary traffic. When networks are divided into smaller segments, broadcast traffic is limited to each subnet, preventing it from affecting the entire network. This leads to more efficient communication and better overall performance.
Representing Data Flow and Traffic Paths
One of the most valuable aspects of a logical network diagram is its ability to show how data flows through the network. Understanding these traffic paths is essential for both design and troubleshooting. A clear representation of data flow helps administrators identify how information moves from one point to another and which devices are involved in the process.
Data flow is often illustrated using arrows or directional lines. These indicators show the path that traffic takes as it travels between devices and subnets. For example, a user request might pass through an access layer device, then move to a distribution layer system, and finally reach a server in the core network. By mapping this journey, the diagram provides a clear picture of the network’s operation.
Including data flow information also helps identify potential bottlenecks. If multiple paths converge on a single device, that device may become a point of congestion. Recognizing these points in the diagram allows administrators to address performance issues before they become critical.
Traffic paths are also important for understanding redundancy and failover mechanisms. In many networks, multiple paths exist to ensure reliability. If one path fails, traffic can be rerouted through an alternative route. Representing these paths in the diagram helps illustrate how the network maintains availability and resilience.
Another benefit of visualizing data flow is improved troubleshooting. When a problem occurs, administrators can use the diagram to trace the expected path of the traffic and identify where it might be disrupted. This structured approach reduces guesswork and speeds up the resolution process.
Including Routing Information and Network Logic
Routing is a central aspect of any logical network diagram. It defines how data moves between different subnets and networks. Including routing information in the diagram helps clarify how devices communicate beyond their immediate segment.
Routing can be represented in several ways, depending on the level of detail required. At a basic level, the diagram may simply show which devices are responsible for routing traffic. In more detailed diagrams, specific routes, protocols, or policies may be included.
Understanding routing logic is essential for interpreting the diagram. For example, traffic destined for a particular subnet must pass through a router that knows how to reach that destination. If the routing information is incorrect or incomplete, communication may fail. Including this information in the diagram helps ensure that administrators can quickly identify and resolve such issues.
Routing also plays a role in redundancy and load balancing. In larger networks, multiple routes may exist between two points. These routes can be used to distribute traffic evenly or provide backup paths in case of failure. Representing these routes in the diagram helps illustrate how the network achieves reliability and efficiency.
Another important aspect of routing is policy enforcement. In some cases, traffic must follow specific paths due to security or performance requirements. Including these policies in the diagram helps ensure that they are understood and maintained.
Highlighting Security Elements in the Diagram
Security is a critical consideration in modern networks, and logical network diagrams should reflect how security measures are implemented. This includes representing devices such as firewalls, intrusion detection systems, and authentication servers.
Firewalls are typically placed at key points in the network, such as the boundary between internal and external networks. They control traffic based on predefined rules, allowing or blocking connections as needed. Including firewalls in the diagram helps illustrate how access is controlled and where security boundaries exist.
Authentication systems are another important element. These systems verify the identity of users and devices before granting access to network resources. Representing these systems in the diagram helps clarify how access control is enforced.
Network segmentation also contributes to security by isolating different parts of the network. Sensitive systems can be placed in restricted zones, while less critical systems remain in more accessible areas. Showing these zones in the diagram provides a clear view of the network’s security architecture.
In addition, logical diagrams can include information about encryption, secure connections, and other protective measures. While not every detail needs to be included, highlighting key security elements ensures that the diagram provides a comprehensive view of how the network is protected.
Organizing the Diagram Using a Layered Approach
One of the most effective ways to structure a logical network diagram is by using a layered approach. This method divides the network into distinct layers, each with a specific role. The most common model includes access, distribution, and core layers.
The access layer is where end devices connect to the network. This includes computers, printers, and other user devices. In the diagram, this layer is typically represented at the bottom, showing how users interact with the network.
The distribution layer acts as an intermediary between the access and core layers. It aggregates traffic from the access layer and applies policies such as routing and filtering. Representing this layer helps illustrate how data is managed and controlled as it moves through the network.
The core layer serves as the backbone of the network. It provides high-speed connectivity between different parts of the network and ensures efficient data transfer. In the diagram, this layer is often placed at the top, representing its central role in the network’s operation.
Using a layered approach helps organize the diagram and makes it easier to understand. It provides a clear structure that reflects the hierarchy of the network and the roles of different components.
Adding Detailed Annotations and Supporting Information
While the visual elements of a logical network diagram are important, annotations and supporting information add depth and clarity. These details provide context that may not be immediately apparent from the diagram itself.
Annotations can include IP addresses, VLAN identifiers, port numbers, and other configuration details. Including this information helps ensure that the diagram is not only visually informative but also technically useful. For example, knowing the IP address of a device can help administrators quickly access it for troubleshooting or configuration.
Supporting information may also include notes about specific configurations or policies. These notes can explain why certain decisions were made or provide guidance for future changes. Including this information helps preserve institutional knowledge and ensures continuity.
It is important to strike a balance when adding details. Too much information can make the diagram cluttered and difficult to read, while too little can limit its usefulness. Using symbols, labels, or references can help keep the diagram clean while still providing access to important details.
Consistency is also key. Using standardized symbols and naming conventions makes the diagram easier to understand and maintain. This is especially important in environments where multiple people are responsible for managing the network.
Ensuring Clarity and Usability in Diagram Design
A logical network diagram is only as effective as its design. Clarity and usability should always be the top priorities. A well-designed diagram communicates information quickly and accurately, while a poorly designed one can cause confusion and errors.
One of the most important aspects of design is simplicity. The diagram should include only the information necessary to achieve its purpose. Unnecessary details should be avoided, as they can distract from the main message.
Layout is another critical factor. Devices and connections should be arranged in a logical and intuitive manner. Grouping related elements together and using clear visual hierarchies can make the diagram easier to understand.
Color and symbols can also be used to enhance clarity. For example, different colors can represent different types of connections or network segments. Symbols can be used to distinguish between different types of devices. However, these elements should be used consistently to avoid confusion.
Finally, the diagram should be easy to update. As the network evolves, the diagram must be modified to reflect changes. Using tools and formats that support easy editing can help ensure that the diagram remains accurate and relevant over time.
By focusing on clarity, organization, and usability, a logical network diagram can become a powerful tool that supports every aspect of network management.
Step by Step Process to Create a Logical Network Diagram
Creating a logical network diagram may seem like a complex task at first, especially in environments where the network has grown organically over time. However, when broken down into a structured process, it becomes far more manageable. The key is to approach the task methodically, ensuring that each step builds on the previous one to form a complete and accurate representation of the network.
The first step is to gather information. Before drawing anything, it is essential to understand what exists in the network. This includes identifying all devices, systems, services, and connections. Without a complete inventory, the diagram will be incomplete and potentially misleading. Administrators often rely on network discovery tools, configuration files, and existing documentation to collect this information.
Once the data is gathered, the next step is to organize it. Devices should be grouped based on their roles and relationships. For example, servers might be grouped together, while routing devices form another group. This organization helps create a clear structure for the diagram and ensures that related components are easy to identify.
After organizing the information, the diagram itself can begin to take shape. Starting with the main entry point of the network, often referred to as the demarcation point, helps establish a logical flow. From there, connections can be drawn to represent how data moves through the network, eventually reaching end systems and services.
Throughout this process, it is important to maintain consistency. Using standardized symbols, naming conventions, and layouts ensures that the diagram is easy to read and understand. Consistency also makes it easier to update the diagram in the future, as changes can be applied without disrupting the overall structure.
Identifying Devices and Their Roles
A critical part of building a logical network diagram is identifying the devices within the network and understanding their roles. Each device contributes to the overall functionality of the network, and accurately representing these roles is essential for creating a meaningful diagram.
Devices that operate at higher levels of the network, such as routers and firewalls, are typically the primary focus. These devices control how data moves between networks and enforce security policies. Including them in the diagram provides insight into the network’s core functionality.
Servers are another important category. These systems host applications, store data, and provide services to users. Depending on the environment, there may be multiple types of servers, such as web servers, database servers, and authentication systems. Each type should be clearly identified in the diagram.
Access devices, such as switches that connect end users, may or may not be included depending on the level of detail required. In many logical diagrams, the focus is on devices that actively process or influence traffic. However, including access devices can provide additional context, especially in smaller networks.
Understanding the role of each device also helps determine how it should be represented. For example, a firewall might be placed between internal and external networks to show its role in controlling access. A router might be positioned between subnets to illustrate its role in directing traffic.
By clearly identifying devices and their roles, the diagram becomes a more accurate reflection of the network’s operation. This clarity is essential for both troubleshooting and planning.
Mapping Connections and Data Paths
Once devices have been identified, the next step is to map the connections between them. These connections represent the logical paths that data follows as it moves through the network. Unlike physical diagrams, these paths do not necessarily correspond to actual cables. Instead, they reflect communication relationships and routing logic.
Mapping data paths requires an understanding of how traffic flows through the network. For example, when a user accesses a web application, the request may pass through several devices before reaching the server. Each step in this journey should be represented in the diagram.
Using directional indicators, such as arrows, can help show the flow of data. This makes it easier to follow the path and understand how different components interact. It also helps identify potential points of failure or congestion.
In more complex networks, multiple paths may exist between devices. These paths can provide redundancy, ensuring that traffic can still flow if one path fails. Including these alternative routes in the diagram helps illustrate the network’s resilience.
It is also important to consider external connections. Many networks connect to external services, such as cloud platforms or remote offices. Representing these connections provides a more complete view of the network and highlights dependencies that may affect performance or availability.
By carefully mapping connections and data paths, the logical network diagram becomes a powerful tool for understanding how the network operates.
Incorporating Subnets and Addressing Schemes
Subnets and IP addressing are fundamental elements of network design, and they play a significant role in logical network diagrams. Including this information helps clarify how the network is structured and how devices are organized.
Each subnet represents a distinct segment of the network, often with its own purpose and set of devices. For example, one subnet might be used for internal users, while another is dedicated to servers or specialized systems. Representing these subnets in the diagram helps illustrate the network’s layout.
IP addressing schemes provide additional context. By including IP ranges or specific addresses, administrators can quickly identify where devices are located within the network. This information is particularly useful for troubleshooting and configuration.
Subnet boundaries can also indicate security zones. For example, a subnet containing sensitive systems may be isolated from the rest of the network. Representing these boundaries helps highlight how access is controlled and where restrictions are applied.
In some cases, advanced addressing concepts such as network address translation or private addressing may be included. While not always necessary, these details can provide valuable insight into how the network handles communication with external systems.
Balancing detail and clarity is important when incorporating addressing information. The goal is to provide enough detail to be useful without overwhelming the diagram with unnecessary complexity.
Using Tools and Techniques for Diagram Creation
Creating a logical network diagram is much easier with the right tools and techniques. There are many software applications available that are specifically designed for diagram creation. These tools provide features such as templates, symbols, and drag and drop interfaces that simplify the process.
Choosing the right tool depends on the needs of the organization. Some tools are better suited for simple diagrams, while others are designed for complex environments with advanced requirements. Regardless of the tool used, the focus should be on clarity and usability.
Templates can be particularly helpful, as they provide a starting point for the diagram. These templates often include common symbols and layouts, making it easier to create a professional looking diagram. However, it is important to customize the template to reflect the specific network being documented.
Collaboration is another important consideration. In many environments, multiple people are involved in managing the network. Using tools that support collaboration allows team members to contribute to the diagram and ensures that it remains accurate.
Version control is also valuable. Keeping track of changes to the diagram helps maintain accuracy and provides a history of how the network has evolved. This can be especially useful when troubleshooting or reviewing past configurations.
By using the right tools and techniques, administrators can create diagrams that are both accurate and easy to maintain.
Common Mistakes to Avoid When Creating Diagrams
While creating a logical network diagram, there are several common mistakes that can reduce its effectiveness. Being aware of these pitfalls can help ensure that the final diagram is both accurate and useful.
One common mistake is including too much detail. While it is important to provide sufficient information, overcrowding the diagram can make it difficult to read. Striking the right balance between detail and clarity is essential.
Another mistake is failing to update the diagram. As networks change, the diagram must be updated to reflect those changes. An outdated diagram can lead to confusion and incorrect assumptions.
Inconsistent symbols and naming conventions can also cause problems. Using different symbols for the same type of device or inconsistent naming can make the diagram harder to understand. Establishing and following standards helps maintain clarity.
Ignoring security elements is another issue. Security is a critical aspect of modern networks, and failing to represent it in the diagram can leave important gaps in understanding.
Finally, poor layout and organization can reduce the effectiveness of the diagram. Devices and connections should be arranged in a logical and intuitive manner, making it easy to follow the flow of data.
Avoiding these mistakes helps ensure that the diagram remains a valuable tool rather than a source of confusion.
Practical Uses of Logical Network Diagrams in Real Environments
Logical network diagrams are not just theoretical tools—they have practical applications in real world environments. One of the most common uses is troubleshooting. When a problem occurs, the diagram provides a reference for understanding how the network is supposed to function. This makes it easier to identify where things are going wrong.
Another important use is planning and design. When adding new devices or services, the diagram helps administrators understand how these additions will fit into the existing network. This reduces the risk of conflicts and ensures a smoother implementation.
Logical diagrams are also valuable for training and onboarding. New team members can use the diagram to quickly understand the network’s structure and operation. This reduces the learning curve and helps them become productive more quickly.
In addition, diagrams support communication with stakeholders. Whether explaining network changes to management or collaborating with other teams, a visual representation makes it easier to convey complex ideas.
Documentation and compliance are other areas where logical diagrams play a role. Many organizations are required to maintain accurate records of their network infrastructure. A well maintained diagram helps meet these requirements and demonstrates good management practices.
Maintaining and Improving Your Network Diagram Over Time
A logical network diagram is not a one time project—it is an ongoing process. As the network evolves, the diagram must be updated and improved to reflect those changes. This requires a proactive approach to documentation.
Regular reviews are an important part of maintenance. Periodically checking the diagram against the actual network helps ensure that it remains accurate. Any discrepancies should be addressed promptly.
Feedback from team members can also be valuable. Those who use the diagram regularly may identify areas for improvement or suggest additional details that would make it more useful.
Automation can help streamline the process. Some tools can automatically discover network devices and update diagrams based on changes. While not perfect, these tools can reduce the manual effort required to maintain the diagram.
It is also important to keep the diagram organized. As new elements are added, maintaining a clear structure prevents the diagram from becoming cluttered. This may involve reorganizing sections or creating multiple diagrams for different purposes.
By treating the diagram as a living document, administrators can ensure that it continues to provide value over time.
Conclusion
A logical network diagram is an essential tool for understanding, managing, and maintaining modern networks. It provides a clear and structured view of how devices, subnets, and systems interact, focusing on functionality rather than physical layout. This perspective allows administrators to grasp complex environments more easily and make informed decisions.
Creating an effective diagram requires careful planning, accurate information, and a focus on clarity. From identifying devices and mapping data paths to incorporating subnets and addressing schemes, each step contributes to a complete representation of the network. Avoiding common mistakes and using appropriate tools further enhances the quality of the diagram.
The true value of a logical network diagram lies in its practical applications. It supports troubleshooting by providing a reference for expected behavior, aids in planning and design by illustrating how changes will affect the network, and improves communication by presenting complex information in a visual format. It also serves as a foundation for training, documentation, and compliance.
Equally important is the ongoing maintenance of the diagram. Networks are constantly changing, and keeping the diagram up to date ensures that it remains a reliable resource. Regular reviews, collaboration, and the use of automation can help maintain accuracy and relevance.
In a field where complexity is the norm, a logical network diagram brings clarity and structure. It transforms abstract configurations into understandable visuals, enabling administrators to work more efficiently and confidently. By investing time and effort into creating and maintaining these diagrams, organizations can build stronger, more resilient networks that are easier to manage and evolve.
Continue exploring the technologies and certification concepts that matter most to you.