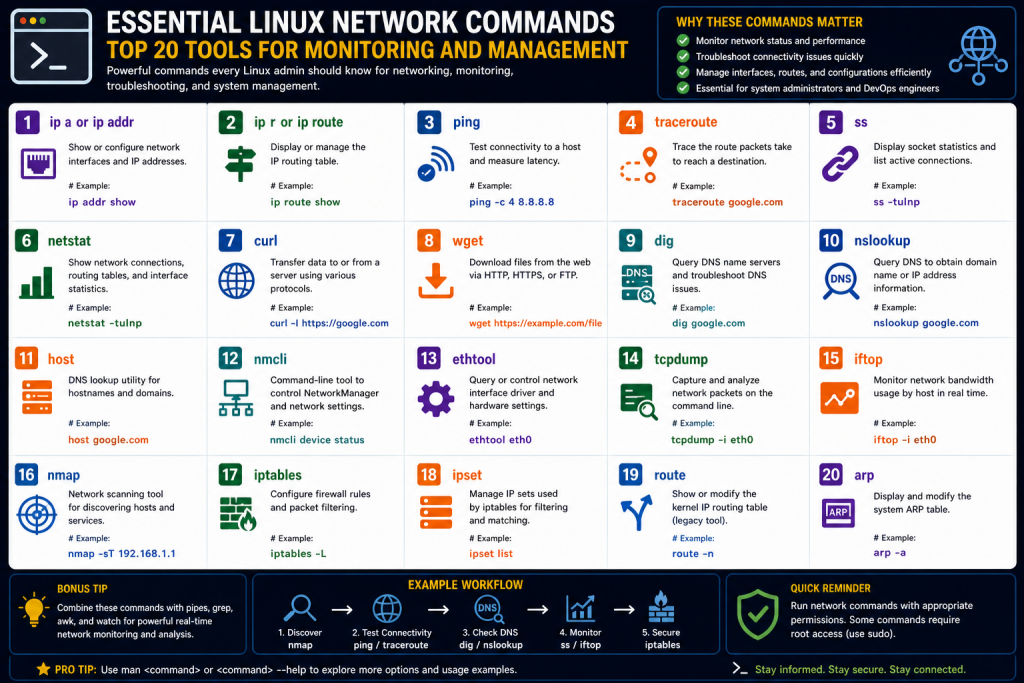
Linux networking offers a deep and flexible set of tools that allow administrators to monitor, analyze, and control network behavior with precision. While this flexibility is powerful, it can also create confusion, especially for those trying to determine which tools are most relevant in modern environments. Over time, some commands have become outdated, while others have evolved into faster and more capable replacements. Understanding these tools is essential for anyone responsible for maintaining reliable and secure systems.
Network monitoring and configuration are not isolated tasks. They are part of a continuous cycle that includes observing traffic, diagnosing issues, optimizing performance, and enforcing policies. The commands covered in this section represent some of the most important utilities for handling these responsibilities effectively. Each tool serves a specific purpose, but together they provide a comprehensive toolkit for managing Linux networks.
Understanding the Role of Network Monitoring Commands
Before diving into individual commands, it is important to understand why network monitoring tools are so critical. In any environment, networks are constantly changing. Traffic patterns fluctuate, services start and stop, and new devices connect or disconnect. Without proper visibility, it becomes nearly impossible to diagnose issues or ensure optimal performance.
Network monitoring commands provide real-time insight into how systems communicate. They allow administrators to observe connections, measure throughput, and identify anomalies. For example, a sudden spike in bandwidth usage could indicate a legitimate workload increase or a potential security issue. Without monitoring tools, distinguishing between the two would be difficult.
Another important aspect is troubleshooting. When users report slow performance or connectivity issues, administrators rely on these commands to identify the root cause. Whether the problem lies in routing, DNS resolution, or packet loss, having the right tools makes the process faster and more efficient.
nmap
Nmap is one of the most powerful tools available for network discovery and security auditing. It is widely used by system administrators, network engineers, and security professionals to scan systems and identify open ports and running services. Although it is not always installed by default, it is considered a must-have utility in most environments.
At its core, nmap allows you to probe a target system and determine which ports are open, closed, or filtered. This information is critical when verifying firewall configurations. For instance, if a server is intended to expose only a web service, nmap can confirm whether any additional ports are accessible. This helps prevent accidental exposure of sensitive services.
Beyond basic scanning, nmap includes advanced features such as service detection and operating system fingerprinting. These capabilities allow administrators to gather detailed information about remote systems without needing direct access. Additionally, its scripting engine enables automated checks for vulnerabilities and misconfigurations.
Despite its power, nmap should be used responsibly. Scanning networks without permission can be considered intrusive or even illegal in some contexts. In controlled environments, however, it remains an essential tool for maintaining security and visibility.
ss
The ss command is a modern replacement for the older netstat utility. It is designed to provide detailed information about network sockets, including active connections and listening ports. One of its key advantages is performance, as it interacts directly with kernel data structures rather than relying on slower methods.
Using ss, administrators can quickly view all active connections on a system. This includes details such as source and destination addresses, port numbers, and connection states. This information is invaluable when diagnosing issues related to connectivity or service availability.
Another important feature of ss is its ability to filter output. For example, you can display only listening ports or only connections associated with a specific protocol. This makes it easier to focus on relevant data without being overwhelmed by unnecessary information.
In modern Linux environments, ss is often the default tool for inspecting network activity at the socket level. Its speed and flexibility make it particularly useful on systems with high connection volumes.
iftop
Iftop is a real-time monitoring tool that focuses on network bandwidth usage. It provides a dynamic view of traffic flowing through a network interface, making it easy to identify which connections are consuming the most resources.
When running iftop, administrators are presented with a continuously updating list of connections ranked by throughput. This allows them to quickly identify heavy users or unusual traffic patterns. For example, if a single host is consuming a disproportionate amount of bandwidth, it can be spotted immediately.
One of the strengths of iftop is its simplicity. It does not require complex configuration and provides immediate insights into network activity. This makes it an excellent choice for quick diagnostics during troubleshooting.
Additionally, iftop displays traffic in both directions, showing how much data is being sent and received. This dual perspective is useful for understanding the full impact of a connection on network resources.
ip route
The ip route command is part of the broader ip utility suite, which has largely replaced older networking tools in Linux. It is used to manage the system’s routing table, which determines how packets are forwarded between networks.
Routing is a fundamental aspect of networking. Every packet sent from a system must follow a path to its destination, and the routing table defines that path. With ip route, administrators can view existing routes and modify them as needed.
For example, in a system with multiple network interfaces, routing rules determine which interface is used for outgoing traffic. Misconfigured routes can lead to connectivity issues or inefficient traffic flow. Using the ip route, administrators can quickly identify and correct such problems.
The command also supports advanced features such as policy-based routing. This allows for more granular control over traffic, enabling decisions based on factors like source address or type of service. As networks become more complex, these capabilities become increasingly important.
iperf3
Iperf3 is a specialized tool used to measure network performance. Unlike simple connectivity tools, it provides detailed insights into throughput, latency, jitter, and packet loss. This makes it an essential utility for evaluating network quality.
The tool operates in a client-server model. One system runs as a server, while another connects as a client to perform tests. This setup allows administrators to measure performance between specific endpoints, making it useful for both local and remote testing.
Iperf3 supports both TCP and UDP protocols. TCP tests are typically used to measure maximum bandwidth, while UDP tests are better suited for analyzing performance under stress conditions. By adjusting parameters such as bandwidth limits and test duration, administrators can simulate real-world scenarios.
This level of flexibility makes iperf3 particularly valuable when diagnosing performance issues. It allows administrators to isolate problems and determine whether they are caused by network limitations or other factors.
tcpdump
Tcpdump is a command-line packet capture tool that provides deep visibility into network traffic. It allows administrators to capture packets as they travel through a network interface and examine their contents in detail.
At a basic level, tcpdump displays packet information in real time. However, its true power lies in its filtering capabilities. Administrators can specify criteria to capture only relevant traffic, such as packets from a specific IP address or using a particular protocol.
This makes tcpdump an essential tool for troubleshooting complex issues. For example, if a service is not responding as expected, tcpdump can be used to verify whether requests are reaching the server and whether responses are being sent.
While the output can be difficult to interpret at first, experience and practice make it easier to understand. Captured data can also be saved to files for later analysis using graphical tools.
ipset
Ipset is a utility designed to simplify firewall rule management. Instead of creating individual rules for each IP address or network, administrators can group them into sets and apply rules more efficiently.
This approach is particularly useful in environments with large or frequently changing address lists. For example, a set can be used to block a list of malicious IP addresses. Updating the set automatically updates all associated firewall rules, reducing administrative overhead.
Ipset is commonly used with iptables, although newer systems are transitioning to nftables, which includes similar functionality. Despite this shift, ipset remains widely used and continues to be relevant in many environments.
By reducing the complexity of firewall configurations, ipset helps administrators maintain clearer and more manageable rulesets.
Wireshark and tshark
Wireshark is a powerful graphical tool for analyzing network traffic. It builds on packet capture techniques and presents data in a structured and user-friendly format. This makes it easier to understand complex interactions between systems.
With Wireshark, administrators can inspect individual packets, follow streams, and analyze protocol behavior. It supports a wide range of protocols and provides detailed metadata for each one. This level of detail is invaluable when diagnosing application-level issues.
Tshark is the command-line version of Wireshark. It offers similar capabilities but is designed for use in terminal environments. This makes it suitable for remote systems or automated workflows.
Together, these tools provide comprehensive visibility into network traffic. They are widely used in both troubleshooting and security analysis.
netcat
Netcat is a flexible networking tool that allows administrators to create and interact with raw network connections. It is often used for testing and debugging services, as well as for transferring data between systems.
One of its most common uses is to check whether a specific port is open on a remote system. Unlike protocol-specific tools, netcat operates at a lower level, making it more versatile.
Netcat can also be used to create simple servers or send custom data over a network. This makes it a valuable tool for experimenting with network behavior and understanding how services respond to different inputs.
Its simplicity and flexibility have made it a staple in the toolkit of many administrators.
traceroute
Traceroute is a classic diagnostic tool used to map the path that packets take through a network. It works by sending packets with increasing Time To Live values, allowing it to identify each hop along the route.
This information is useful for understanding how traffic flows between systems. It can help identify routing issues, detect loops, or reveal unexpected paths.
In addition to mapping the route, traceroute provides latency information for each hop. This helps administrators identify slow segments of the network and pinpoint potential bottlenecks.
Despite being one of the oldest networking tools, traceroute remains highly relevant. Its ability to visualize network paths makes it an essential part of any troubleshooting process.
Linux networking does not stop at observing traffic or scanning systems. Once the foundational tools are understood, administrators must go deeper into diagnostics, path analysis, and name resolution. These areas are critical because many real-world issues are not caused by simple connectivity failures but by intermittent routing problems, DNS misconfigurations, or subtle protocol-level inconsistencies.
The commands covered in this section build on the earlier foundation and focus on tracing network paths, resolving domain names, inspecting neighbor relationships, and validating connectivity in more detail. These tools are often used together during troubleshooting, forming a layered approach to diagnosing complex network issues.
mtr
Mtr combines the functionality of two well-known tools: ping and traceroute. Instead of running a one-time path trace, mtr continuously sends packets and updates statistics in real time. This makes it particularly useful for identifying intermittent or transient network problems.
When using mtr, administrators can observe how latency and packet loss change over time for each hop along the path. This is important because some network issues do not appear consistently. A single traceroute might look normal, but running mtr over several minutes can reveal patterns such as periodic packet drops or fluctuating latency.
Another advantage of mtr is its interactive display. It provides a live view of network performance, allowing administrators to quickly identify problematic hops. For example, if one router consistently shows higher latency or packet loss, it can be isolated as a potential source of the issue.
Mtr is widely used in both local and internet-based troubleshooting. It is especially valuable when dealing with unstable connections or performance complaints that cannot be reproduced consistently.
ip neigh
The ip neigh command is part of the ip utility suite and is used to manage neighbor tables. In IPv4 networks, this corresponds to the Address Resolution Protocol, which maps IP addresses to MAC addresses. In IPv6, it handles Neighbor Discovery Protocol entries.
Understanding neighbor relationships is essential for diagnosing local network issues. When a system cannot communicate with another device on the same network, the problem may lie in address resolution. Using ip neigh, administrators can view cached entries and verify whether the correct mappings exist.
For example, if a device is reachable at the IP level but not responding to traffic, checking the neighbor table can reveal whether the system has the correct MAC address associated with that IP. Incorrect or stale entries can cause communication failures.
The command also allows administrators to add, modify, or remove entries. This can be useful in testing scenarios or when troubleshooting specific issues. Compared to older tools, ip neigh provides a more unified and modern interface for managing these relationships.
nslookup
Nslookup is one of the earliest tools developed for querying Domain Name System servers. It allows administrators to request information about domain names, such as their associated IP addresses or mail server records.
Although nslookup is still available on many systems, it is generally considered a legacy tool. Its output format is less detailed compared to newer utilities, and it does not always reflect how modern systems perform DNS resolution, especially when advanced resolver configurations are involved.
Despite these limitations, nslookup remains useful for quick and simple queries. For example, an administrator can use it to check whether a domain resolves correctly or to query a specific DNS server for information.
Its simplicity can be an advantage in basic troubleshooting scenarios. However, for more detailed analysis, other tools are often preferred.
dig
Dig is a more advanced DNS query tool that provides detailed information about domain name resolution. It is widely used by system administrators for diagnosing DNS-related issues and understanding how queries are processed.
When running dig, the output includes both the query and the response, along with additional metadata such as the Time To Live value. This information is important for understanding caching behavior. For instance, if a DNS record has a long TTL, changes may not propagate immediately across the network.
Dig also allows administrators to specify different record types, such as A, AAAA, MX, or TXT records. This flexibility makes it suitable for a wide range of tasks, from verifying website configurations to troubleshooting email delivery issues.
Another advanced feature of dig is its ability to perform zone transfers using the AXFR protocol. While this is typically restricted for security reasons, it can be useful in controlled environments where administrators need a complete view of DNS records.
Overall, dig is considered the standard tool for DNS diagnostics in modern Linux systems.
host
The host command is another utility for performing DNS lookups. It is designed to be simple and straightforward, providing quick answers without the detailed output of tools like dig.
Using host, administrators can quickly determine the IP address associated with a domain or perform reverse lookups to find the domain name associated with an IP address. This makes it useful for everyday tasks where detailed analysis is not required.
One of the strengths of the host is its ease of use. It requires minimal syntax and produces clean, readable output. This makes it a convenient option for quick checks or scripting.
While it may not offer the same level of detail as dig, it serves as a practical tool for fast and efficient DNS queries.
whois
The whois command is used to retrieve information about domain name registrations. When a domain is registered, details about the owner, registrar, and registration dates are stored in a public database. Whois queries this database and returns the available information.
This tool is particularly useful when investigating domains. For example, if suspicious activity is associated with a domain, administrators can use whois to identify the registrar or contact information. This can help in reporting abuse or understanding the origin of the domain.
In many cases, domain owners choose to hide their personal information using privacy services. This limits the amount of data available through whois. However, even in these cases, the command can still provide useful metadata, such as registration and expiration dates.
Whois remains a valuable tool for network administrators and security professionals who need to gather information about domains.
ping
Ping is one of the most fundamental networking tools and is used to test connectivity between systems. It works by sending Internet Control Message Protocol echo requests and measuring the time it takes to receive a response.
The primary purpose of ping is to determine whether a host is reachable. If responses are received, it indicates that the network path is functioning. If not, it suggests a connectivity issue that needs further investigation.
In addition to basic reachability, ping provides information about latency and packet loss. These metrics are critical for assessing network performance. For example, high latency or frequent packet loss can indicate congestion or hardware issues.
One of the distinguishing features of ping in Linux is that it runs continuously by default. This allows administrators to monitor changes over time and observe patterns. It can also be configured with different packet sizes or intervals to simulate various conditions.
Ping is often the first tool used in troubleshooting because it provides quick and immediate feedback about network health.
nmcli
Nmcli is a command-line interface for managing NetworkManager, a service that handles network configuration on many Linux systems. It allows administrators to configure interfaces, manage connections, and control network settings without using a graphical interface.
With nmcli, administrators can view the status of network interfaces, connect to networks, and modify settings such as IP addresses and DNS servers. This is particularly useful on servers or remote systems where graphical tools are not available.
One of the key benefits of NetworkManager is its ability to store persistent configurations. This ensures that network settings are preserved across reboots. Nmcli provides a way to interact with these configurations directly from the command line.
The tool also supports scripting, making it possible to automate network configuration tasks. This is valuable in environments where consistent setups are required across multiple systems.
ip
The ip command is one of the most important tools in modern Linux networking. It replaces several older utilities, including ifconfig, route, and arp, by providing a unified interface for managing network settings.
Using ip, administrators can view and configure IP addresses, bring interfaces up or down, and inspect routing tables. It also includes functionality for managing neighbor entries and tunnels, making it a comprehensive tool for network management.
One of the reasons ip has become the standard is its consistency. All subcommands follow a similar structure, making it easier to learn and use. This is in contrast to older tools, which often had inconsistent syntax.
The ip command is essential for both basic and advanced networking tasks. Whether configuring a new interface or troubleshooting connectivity issues, it provides the necessary functionality in a single toolset.
tracepath
Tracepath is similar to traceroute but has some key differences that make it useful in certain situations. One of its main advantages is that it does not require elevated privileges, allowing it to be used on systems where administrative access is limited.
Like traceroute, tracepath maps the path between two systems by analyzing how packets travel through the network. It provides information about each hop and the associated latency.
In addition to path tracing, tracepath includes functionality for detecting the Maximum Transmission Unit along the path. This is important because mismatched MTU values can lead to packet fragmentation or loss, especially in environments with tunnels or virtual networks.
By identifying the effective MTU, tracepath helps administrators optimize network performance and avoid issues related to packet size. This makes it a valuable tool in modern networking scenarios.
The Importance of Combining These Tools
While each command discussed serves a specific purpose, their true value comes from how they are used together. Network troubleshooting is rarely a linear process. Instead, it involves gathering information from multiple sources and correlating the results.
For example, an administrator might start with ping to check basic connectivity. If latency is high, mtr can provide a deeper view of where delays are occurring. If the issue appears to be related to name resolution, dig or host can be used to verify DNS responses. If local communication is failing, ip neigh can help identify address resolution issues.
This layered approach allows administrators to narrow down problems efficiently. By combining tools, they can move from general observations to specific diagnoses without unnecessary guesswork.
Linux networking tools are not just individual utilities used in isolation. Their real value becomes clear when they are applied together in practical scenarios. In production environments, issues rarely present themselves in a straightforward way. Instead, administrators must interpret symptoms, test assumptions, and use multiple commands to build a complete picture of what is happening.
This section focuses on how these commands are applied in real-world situations, how they complement one another, and how administrators can develop efficient workflows. It also explores how modern Linux networking continues to evolve and why understanding both legacy and current tools remains important.
Building a Troubleshooting Workflow
One of the most important skills for a Linux administrator is developing a structured troubleshooting approach. Without a clear method, it is easy to jump between tools without making progress. The commands discussed earlier provide all the necessary building blocks, but knowing when to use each one is critical.
A typical workflow often begins with basic connectivity checks. If a system cannot reach a destination, the first step is usually to test reachability. From there, the process becomes more detailed. Administrators may examine routing paths, inspect DNS resolution, and analyze traffic at the packet level.
For example, if a user reports that a website is not loading, the issue could be related to DNS, routing, firewall rules, or application behavior. Using tools like ping and dig helps determine whether the domain resolves and whether the host is reachable. If the connection is slow or inconsistent, mtr can reveal where latency is introduced.
This layered approach ensures that problems are addressed logically rather than through guesswork. It also reduces the time required to identify and resolve issues.
Diagnosing Connectivity Problems
Connectivity issues are among the most common challenges in networking. They can range from complete outages to intermittent failures. Linux provides several tools that help isolate these problems quickly.
The first step is often to verify whether the target system is reachable. If packets are not returning, it may indicate a routing issue, firewall restriction, or network failure. In such cases, examining the routing table using modern tools can reveal whether traffic is being directed correctly.
If the path to the destination is unclear, tracing tools can map the route and identify where communication breaks down. This is particularly useful in environments with multiple routers or complex network topologies.
Another important factor is local configuration. Misconfigured interfaces or incorrect IP addresses can prevent communication even if the network itself is functioning correctly. Tools that display interface details and neighbor relationships help ensure that the system is configured properly.
By combining these techniques, administrators can quickly determine whether a problem is local, remote, or somewhere in between.
Investigating Performance Issues
Not all network problems involve complete failure. In many cases, systems are reachable but perform poorly. Slow response times, high latency, and packet loss can significantly impact applications and user experience.
Performance testing tools play a key role in diagnosing these issues. By measuring throughput and latency between systems, administrators can determine whether the network is meeting expected performance levels. If not, further analysis is required to identify the cause.
Real-time monitoring tools are particularly useful in this context. They allow administrators to observe bandwidth usage and identify which connections are consuming the most resources. This can reveal whether a single application or user is affecting overall performance.
Packet analysis tools also provide valuable insights. By capturing and examining traffic, administrators can detect retransmissions, errors, or unusual patterns that indicate underlying problems. While this level of analysis requires more expertise, it is often necessary for resolving complex issues.
Understanding performance requires both measurement and observation. By using the right combination of tools, administrators can move beyond symptoms and identify root causes.
Understanding DNS and Its Impact
Domain Name System resolution is a critical component of modern networking. Many applications rely on domain names rather than IP addresses, making DNS issues a common source of problems.
When a domain fails to resolve, the issue may lie with the local resolver, the configured DNS server, or the authoritative server for the domain. Tools designed for DNS queries allow administrators to test each layer independently.
For example, querying a specific DNS server can reveal whether it is responding correctly. Examining response details such as Time To Live values helps determine whether caching is affecting results. If different servers return different answers, it may indicate propagation delays or misconfiguration.
Reverse lookups are also useful for verifying that IP addresses are correctly associated with domain names. This is particularly important in environments where authentication or logging depends on reverse DNS.
DNS troubleshooting often requires patience, as changes may take time to propagate. However, with the right tools, administrators can verify each step of the resolution process and identify where issues occur.
Managing Network Interfaces and Configuration
Proper network configuration is essential for stable operation. Linux systems often have multiple interfaces, each with its own settings. Managing these interfaces effectively requires tools that provide both visibility and control.
Modern utilities allow administrators to view interface status, assign IP addresses, and bring interfaces up or down. These actions are fundamental when configuring new systems or troubleshooting connectivity issues.
Persistent configuration is another important aspect. Systems need to retain their network settings across reboots, which is handled by services that store and apply configurations. Command-line tools provide a way to interact with these services, making it possible to modify settings without a graphical interface.
In dynamic environments, interfaces may be added or removed frequently. Ensuring that each interface is configured correctly helps prevent conflicts and ensures consistent behavior. Automation can also play a role, allowing administrators to apply standardized configurations across multiple systems.
Security Considerations in Network Monitoring
Network monitoring tools are not only useful for troubleshooting but also for maintaining security. By observing traffic and scanning systems, administrators can identify potential vulnerabilities and unauthorized activity.
Port scanning tools help verify which services are exposed to the network. This is important for ensuring that only intended services are accessible. Unexpected open ports may indicate misconfiguration or compromise.
Traffic analysis tools provide deeper insights into how data moves through the network. Unusual patterns, such as unexpected connections or high volumes of traffic, can signal potential threats. Early detection allows administrators to take action before issues escalate.
Firewall management tools also contribute to security by controlling which traffic is allowed or blocked. Grouping addresses and applying rules efficiently helps maintain clear and effective policies.
Security is an ongoing process, and network monitoring tools play a central role in maintaining a secure environment.
Adapting to Modern Linux Networking
Linux networking continues to evolve, with newer tools replacing older ones and providing enhanced functionality. Commands like ip and ss have become standard, while others are gradually being phased out.
This evolution reflects changes in how networks are designed and managed. Modern environments often include virtualization, containers, and cloud infrastructure, all of which introduce additional complexity. Tools must adapt to handle these scenarios effectively.
At the same time, legacy tools remain relevant in certain contexts. Older systems may still rely on them, and documentation often references them. Understanding both old and new tools ensures that administrators can work across different environments without confusion.
Staying current with these changes is important for maintaining efficiency and effectiveness. As new tools emerge, they often provide better performance, improved usability, and enhanced capabilities.
Developing Expertise Through Practice
Learning networking commands is only the first step. True expertise comes from applying them in real situations. Hands-on practice helps administrators understand how tools behave under different conditions and how to interpret their output.
Setting up test environments is a valuable way to gain experience. By simulating network issues, administrators can practice troubleshooting without affecting production systems. This builds confidence and prepares them for real-world challenges.
Documentation and experimentation also play a role. Exploring different command options and understanding their effects helps deepen knowledge. Over time, administrators develop intuition, allowing them to choose the right tool quickly and use it effectively.
Experience is what transforms a collection of commands into a practical skillset. With consistent practice, these tools become second nature.
Integrating Tools for Efficient Operations
Efficiency in network administration comes from integrating tools into cohesive workflows. Rather than treating each command as a separate task, administrators can combine them to streamline operations.
For example, a troubleshooting session might involve checking connectivity, analyzing routes, verifying DNS resolution, and capturing traffic. By moving seamlessly between tools, administrators can gather all necessary information without unnecessary delays.
Automation further enhances efficiency. Scripts can be used to run multiple commands and collect results in a structured format. This is particularly useful for repetitive tasks or large-scale environments.
Integration also involves understanding how tools complement each other. Some provide high-level overviews, while others offer detailed analysis. Using them together ensures that no aspect of the network is overlooked.
Conclusion
Linux network monitoring and configuration commands form a comprehensive toolkit for managing modern systems. From basic connectivity checks to advanced packet analysis, these tools provide the visibility and control needed to maintain reliable and secure networks.
The key to mastering them lies not only in understanding each command but also in knowing how to apply them together. Real-world troubleshooting requires a structured approach, combining multiple tools to identify and resolve issues efficiently.
As Linux networking continues to evolve, these commands remain essential. By developing practical experience and staying current with new developments, administrators can confidently handle the challenges of modern network environments.
Continue exploring the technologies and certification concepts that matter most to you.