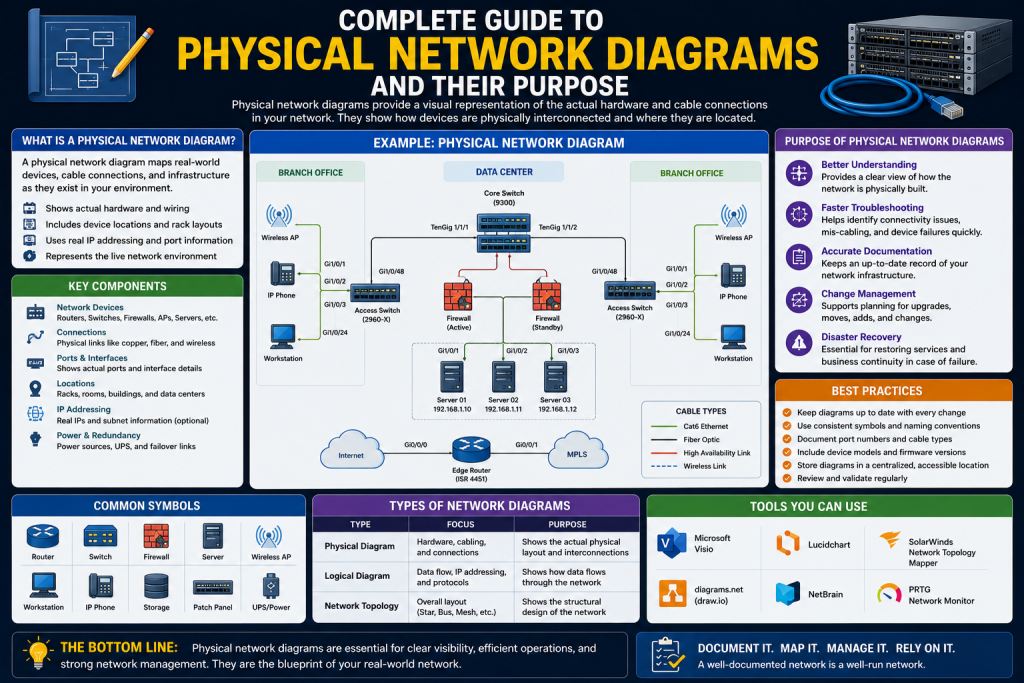
A physical network diagram is one of the most important tools in modern IT infrastructure management. As organizations grow and rely more heavily on digital systems, understanding how hardware components are physically arranged becomes essential for performance, reliability, and troubleshooting. Unlike abstract representations of data flow, a physical network diagram shows the real-world placement of devices such as routers, switches, servers, cables, and racks. It acts as a blueprint of the entire network environment.
In addition to showing device locations, a physical network diagram also helps IT teams understand how power, cooling, and physical space affect network performance. For example, servers placed too close together in a rack may overheat, while poorly organized cabling can lead to maintenance difficulties and accidental disconnections. By visualizing these physical relationships, teams can make better design decisions that improve efficiency and reduce risk.
Another important benefit is its role in disaster recovery and incident response. When hardware failures occur, technicians can quickly identify the exact location of affected devices and trace all connected components. This reduces downtime and helps restore services faster. Physical network diagrams are also valuable during audits, compliance checks, and infrastructure upgrades because they provide clear documentation of all installed equipment.
Furthermore, as networks become more complex with hybrid cloud and on-premise environments, maintaining accurate physical diagrams ensures better coordination between different IT teams.
In simple terms, it answers questions like: Where is each device located? How are they physically connected? What hardware supports the organization’s communication systems? This article explores the meaning, importance, components, creation process, and best practices of physical network diagrams in detail.
What is a Physical Network Diagram?
A physical network diagram is a visual representation of the actual hardware layout of a network. It maps out physical devices and shows how they are interconnected through cables and ports. Unlike logical diagrams, which focus on data movement and IP addressing, physical diagrams focus on tangible infrastructure.
These diagrams typically include:
- Routers and switches
- Servers and storage systems
- Firewalls and access points
- Cabling paths and connectors
- Server racks and data center layouts
Think of it as a real-world map of your IT environment. Instead of showing cities and roads, it shows devices and cables. This makes it extremely useful for technicians working directly with hardware.
Why Physical Network Diagrams Are Important
Physical network diagrams play a crucial role in managing IT infrastructure effectively. Without them, organizations often face confusion, inefficiency, and downtime during troubleshooting or expansion. These diagrams provide a clear visual reference that helps IT teams quickly locate devices, understand connections, and identify potential points of failure. They also improve coordination between different departments by offering a shared understanding of the network layout. During system upgrades or migrations, physical diagrams help ensure that changes are implemented smoothly without disrupting existing services. Additionally, they support better documentation practices, making it easier to train new staff and maintain consistency across large and complex network environments.
Visual Understanding of Infrastructure
One of the biggest advantages is clarity. A well-designed diagram gives IT teams a complete view of how the network is physically arranged. This eliminates guesswork and helps teams quickly locate devices.
Faster Troubleshooting
When a network issue occurs, time is critical. A physical diagram helps technicians quickly identify where a device is located and how it connects to the rest of the system. This reduces downtime and speeds up recovery.
Better Planning and Expansion
As organizations grow, new devices and systems are added. Physical diagrams help IT teams plan expansions without disrupting existing infrastructure. They ensure there is enough space, power, and connectivity for future growth.
Improved Communication
Not everyone in an organization understands technical networking concepts. Physical diagrams bridge this gap by providing a simple visual representation that both technical and non-technical stakeholders can understand.
Reduced Operational Errors
With accurate documentation, the chances of misconfigurations or incorrect cable connections are significantly reduced. This improves overall network stability.
Key Components of a Physical Network Diagram
A physical network diagram is made up of several important components that together represent the entire infrastructure.
Floor Plan Representation
A floor plan shows the layout of the physical environment, such as offices, server rooms, or data centers. It indicates where devices are installed in real space.
This includes:
- Workstations in office areas
- Servers in dedicated rooms
- Cable routing paths across floors
- Power outlets and network ports
A floor plan helps teams understand how physical space impacts network design.
Rack Diagrams
Rack diagrams focus on server racks, which are essential in data centers. These diagrams show how devices are arranged inside each rack, often in a vertical structure.
They include:
- Servers and storage devices
- Patch panels and switches
- Power distribution units
- Cooling considerations
Rack diagrams are essential for optimizing space and ensuring proper airflow and cable management. Poor rack organization can lead to overheating and maintenance challenges.
MDF and IDF Documentation
In larger networks, distribution points are critical.
The Main Distribution Frame (MDF) is the central hub where external internet or network connections enter the organization. It is usually located in a primary server room or data center.
Intermediate Distribution Frames (IDFs) are smaller distribution points located across different floors or buildings. They connect local devices to the central MDF.
Proper documentation of MDF and IDF includes:
- Port mapping
- Cable labeling
- Device connections
- Uplink and downlink paths
This ensures smooth communication across large-scale networks.
Network Devices and Connections
Every physical network diagram includes detailed representation of network devices such as:
- Switches that connect multiple devices
- Routers that manage traffic between networks
- Firewalls that protect against threats
- Access points for wireless connectivity
Connections between these devices are shown using lines representing cables, such as Ethernet or fiber optic links.
How to Create a Physical Network Diagram
Creating an effective physical network diagram requires planning, tools, and collaboration.
Choose the Right Tools
There are several tools available for creating network diagrams, including:
- Microsoft Visio
- Lucidchart
- Draw.io
- SolarWinds Network Topology Mapper
Advanced tools may even integrate real-time monitoring with diagrams.
Gather Network Information
Before drawing anything, collect complete information about the network:
- Device types and locations
- IP addresses and ports
- Cable types and connections
- Rack layouts and floor plans
Accurate data ensures the diagram reflects reality.
Map Physical Layout
Start by creating a floor plan or rack layout. Place devices exactly where they exist in the physical environment. This step ensures spatial accuracy.
Add Devices and Connections
Next, add all network devices and connect them using appropriate lines representing cables. Review and Validate
Validation is critical. IT engineers should review the diagram to ensure accuracy. Any missing or incorrect information should be corrected immediately.
Best Practices for Maintaining Physical Network Diagrams
A physical network diagram is not a one-time task. It must be maintained continuously.
Keep Diagrams Updated
Every time a device is added, removed, or moved, the diagram must be updated immediately. Outdated diagrams can cause serious operational issues.
Use Standard Labeling
Consistent labeling helps avoid confusion. Use clear naming conventions such as SWITCH-01 or SERVER-RACK-A3.
Apply Color Coding
Color coding improves readability. For example:
- Blue for data cables
- Red for power cables
- Green for fiber connections
This makes diagrams easier to interpret quickly.
Conduct Regular Audits
Regular audits ensure that the diagram matches the actual infrastructure. IT teams should physically inspect systems at least once or twice a year.
Integrate with Monitoring Systems
Modern IT environments benefit from integrating diagrams with monitoring tools. This allows real-time visibility into device status and network health.
Use Version Control
Maintain different versions of diagrams so changes can be tracked over time. This helps in troubleshooting and auditing.
Challenges in Managing Physical Network Diagrams
While extremely useful, maintaining physical network diagrams comes with challenges.
Rapid Infrastructure Changes
Networks evolve quickly, especially in large organizations. Keeping diagrams updated in real time can be difficult.
Human Error
Manual updates can lead to mistakes such as missing devices or incorrect connections.
Lack of Standardization
Without proper standards, diagrams can become inconsistent and confusing across teams.
Future of Physical Network Diagrams
The future of physical network diagrams is evolving with technology. Artificial intelligence and automation are starting to play a role in automatically generating and updating diagrams based on real-time network data.
Augmented reality may also allow technicians to view live network layouts by scanning server rooms with mobile devices. This will make troubleshooting faster and more intuitive.
Cloud-based tools are also improving collaboration, allowing global teams to update and access diagrams in real time.
Conclusion
Physical network diagrams are a foundational element of modern IT infrastructure management. They provide a clear and accurate representation of how network hardware is physically arranged and connected. From floor plans to rack layouts and MDF/IDF documentation, these diagrams simplify complex systems and make them easier to manage.
They are essential for troubleshooting, planning, communication, and scalability. Without them, managing a growing network becomes chaotic and error-prone.
By following best practices such as regular updates, standard labeling, and proper documentation, organizations can ensure their physical network diagrams remain reliable and effective. As technology continues to evolve, these diagrams will become even more powerful through automation and intelligent systems.
In short, a well-maintained physical network diagram is not just documentation—it is a critical operational tool that keeps modern IT environments running smoothly.
Continue exploring the technologies and certification concepts that matter most to you.