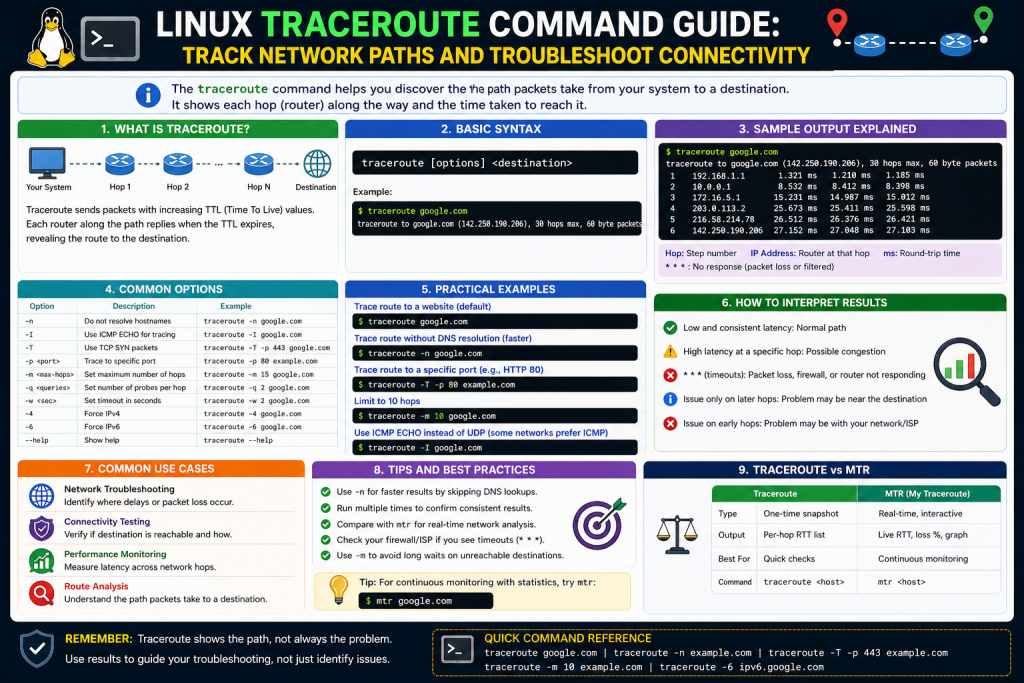
In modern computing environments, network connectivity plays a critical role in ensuring systems communicate effectively. When something goes wrong, such as slow internet performance or an unreachable server, diagnosing the issue can be challenging without the right tools. One of the most reliable and widely used utilities available in Linux for this purpose is the traceroute command.
Traceroute is a command-line tool that allows users to trace the path taken by data packets from a source system to a destination host. It provides detailed insight into how data travels across networks, including every intermediate device it passes through. These intermediate devices are typically routers, and each step in the journey is referred to as a hop.
The primary purpose of traceroute is to help identify where delays or failures occur along a network path. Instead of simply knowing that a connection is slow or broken, traceroute shows exactly where the issue might be happening. This makes it an essential utility for system administrators, network engineers, and even regular users who want to better understand network behavior.
Traceroute is included in most Linux distributions by default, which means users can start using it immediately without installing additional software. Its simplicity and effectiveness make it one of the first tools people turn to when troubleshooting network issues.
Why Traceroute Is Important in Networking
Networks today are highly complex systems that span across multiple regions, devices, and service providers. When you attempt to connect to a website or server, your data does not travel directly to its destination. Instead, it moves through a series of routers and gateways, each making decisions about where to send the data next.
Because of this complexity, identifying the exact location of a network issue can be difficult. A slow connection could be caused by problems in your local network, your internet service provider, or even somewhere on the global internet. Traceroute helps eliminate this uncertainty by providing a detailed map of the route taken by your data.
With traceroute, you can determine whether a problem is occurring close to your system or further along the path. This information is valuable when deciding how to resolve the issue. For example, if the delay occurs within your local network, you can investigate your router or internal configuration. If the problem lies outside your network, you may need to contact your service provider.
Another important aspect of traceroute is its ability to reveal routing behavior. Sometimes data does not take the most efficient path to its destination, which can result in increased latency. By analyzing traceroute output, you can identify inefficient routes and better understand how traffic flows across networks.
How Data Travels Across Networks
To fully understand traceroute, it is helpful to first understand how data moves across a network. When you send a request to a server, such as opening a website, your system breaks the data into smaller units called packets. These packets are then sent across the network toward the destination.
Each packet contains important information, including the source address, destination address, and a field known as Time To Live, or TTL. The TTL value determines how many hops a packet can make before it is discarded. This mechanism prevents packets from circulating indefinitely in the event of routing loops.
As packets travel through the network, they pass through routers. Each router examines the packet and decides where to send it next. During this process, the router reduces the TTL value by one. If the TTL reaches zero, the router discards the packet and sends a message back to the sender indicating that the time has been exceeded.
This behavior is essential for how traceroute works, as it uses TTL values to identify each hop along the path.
How Traceroute Works Step by Step
Traceroute uses a systematic approach to discover the path between a source and a destination. It does this by sending packets with gradually increasing TTL values and analyzing the responses received from routers along the way.
The process begins with traceroute sending a packet with a TTL value of one. The first router that receives this packet decreases the TTL to zero, discards the packet, and sends a response back to the source. This response identifies the first hop.
Next, traceroute sends another packet with a TTL value of two. This packet passes through the first router successfully but expires at the second router. The second router then sends a response back, revealing the second hop.
This process continues, with traceroute increasing the TTL value for each new packet. Each router along the path responds when the TTL expires, allowing traceroute to build a complete map of the route.
Eventually, the packet reaches the destination host. At this point, the destination sends a different type of response, indicating that the trace is complete. By collecting all of these responses, traceroute is able to display the entire path from the source to the destination.
Role of ICMP and Other Protocols
Traceroute relies on network protocols to send packets and receive responses. By default, it often uses UDP packets, but it can also use ICMP or TCP depending on how it is configured.
ICMP, or Internet Control Message Protocol, is commonly used for diagnostic purposes. It is the same protocol used by the ping command. When a packet expires due to a TTL reaching zero, the router sends an ICMP time exceeded message back to the source.
UDP, or User Datagram Protocol, is typically used by traceroute for sending probe packets. When these packets reach the destination, the destination responds with a port unreachable message, signaling the end of the trace.
TCP, or Transmission Control Protocol, can also be used in situations where UDP or ICMP traffic is blocked by firewalls. This makes traceroute more flexible and capable of working in different network environments.
Understanding these protocols is important because they influence how traceroute behaves and how its results should be interpreted.
What Information Traceroute Provides
When you run traceroute, it generates output that contains several types of information for each hop along the path. This information helps you analyze the network route and identify potential issues.
The first piece of information is the hop number. This indicates the position of the router in the sequence, starting from one and increasing with each step toward the destination.
Next, traceroute displays the IP address of the router. In many cases, it also shows the hostname associated with that IP address, provided that DNS resolution is enabled.
Another important element is the response time, usually measured in milliseconds. Traceroute typically sends multiple probes to each hop and displays the time taken for each one. These values help identify delays and measure latency.
By combining these details, traceroute provides a comprehensive view of the network path, allowing users to see both the structure of the route and the performance at each step.
Basic Usage of Traceroute in Linux
Using traceroute in Linux is straightforward and requires only a basic understanding of the command line. To begin, you open a terminal window and type the traceroute command followed by the destination you want to test.
For example, you can run traceroute to a domain name or an IP address. Once executed, the command starts sending packets and displays the results in real time. Each line of output corresponds to a hop, showing the information gathered from that point in the network.
Because traceroute is preinstalled on most Linux systems, there is no need for additional setup. This makes it an accessible tool for anyone who wants to perform network diagnostics.
Even though the basic command is simple, traceroute offers a wide range of options that allow you to customize its behavior. These options can be used to adjust timeouts, limit the number of hops, or change the protocol used for tracing.
Advantages of Using Traceroute
Traceroute offers several advantages that make it a valuable tool for network troubleshooting. One of its main strengths is its ability to provide detailed insights without requiring access to intermediate devices. You do not need administrative privileges on routers to see how your data travels through them.
Another advantage is its speed. Traceroute can quickly generate results, allowing you to identify issues in a matter of seconds. This is especially useful in time-sensitive situations where quick diagnosis is important.
Traceroute is also versatile. It can be used in a variety of environments, from small local networks to large-scale internet infrastructure. Its compatibility with different protocols ensures that it remains effective even when certain types of traffic are restricted.
In addition, traceroute helps improve understanding of network behavior. By analyzing its output, users can learn how routing works and gain insights into the structure of networks.
Limitations of Traceroute
Despite its usefulness, traceroute has some limitations that should be considered. One common limitation is that not all routers respond to traceroute packets. Some devices are configured to ignore these requests for security or performance reasons.
Firewalls can also block the packets used by traceroute, resulting in incomplete or misleading output. In such cases, it may appear as though there is a problem in the network when the lack of response is actually intentional.
Another limitation is related to load balancing. In networks that use load balancing, packets may take different paths to the same destination. This can cause traceroute to display inconsistent routes, making it harder to interpret the results.
Additionally, high response times do not always indicate a problem. Some routers prioritize forwarding traffic over responding to diagnostic requests, which can result in artificially high latency values.
Understanding these limitations is important for accurately interpreting traceroute results and avoiding incorrect conclusions.
Getting Started with Traceroute in Practical Scenarios
After understanding the basic concept and working mechanism of traceroute, the next step is to apply it in real-world situations. While the idea behind traceroute is relatively simple, using it effectively requires familiarity with its command structure, available options, and output interpretation.
Traceroute is executed directly from the Linux terminal. It does not require complex setup, and in most cases, it is already installed on the system. This makes it a convenient tool for quick diagnostics whenever network issues arise.
To begin using traceroute, you open a terminal and enter the command followed by the destination you want to trace. The destination can be a domain name or an IP address. Once the command is executed, traceroute starts sending packets and displays the results line by line.
The output appears almost instantly, and each line represents a step in the network path. By reading and understanding this output, you can gain valuable insights into how your data travels and where potential issues might exist.
Basic Command Structure and Execution
The simplest way to use traceroute is by specifying a destination. When you run the command, traceroute begins probing the route to that destination and records the responses from each hop.
Each probe sent by traceroute is designed to trigger a response from routers along the path. These responses are then used to construct a map of the route. The process continues until the destination is reached or the maximum number of hops is exceeded.
By default, traceroute sends multiple probes for each hop. This helps provide a more accurate representation of latency and ensures that temporary fluctuations do not skew the results.
The command executes in real time, meaning you can watch the path being discovered step by step. This immediate feedback is one of the reasons traceroute is so useful for troubleshooting.
Understanding the Output Line by Line
Traceroute output may look technical at first glance, but it follows a consistent and logical format. Each line corresponds to a hop and contains specific pieces of information that help you analyze the network path.
The first element is the hop number. This indicates the position of the router in the sequence. The numbering starts at one and increases as the packets move closer to the destination.
Next, you typically see the hostname and IP address of the router. If the system is able to resolve the IP address into a hostname, both will be displayed. Otherwise, only the IP address appears.
Following this, traceroute shows multiple response times. These are usually measured in milliseconds and represent the time it took for each probe to travel to that hop and back. Having multiple values helps identify consistency or variability in response times.
By examining each of these components, you can build a clear picture of the network path and identify any irregularities.
Interpreting Response Times and Latency
One of the most important aspects of traceroute output is the response time. This value indicates how long it takes for a packet to reach a particular hop and return to the source.
Low response times generally indicate that the connection between hops is fast and efficient. High response times, on the other hand, may suggest congestion, slow hardware, or long physical distances.
It is important to look at patterns rather than individual values. A single high response time may not be significant, especially if subsequent probes show lower values. However, consistently high response times at a particular hop can indicate a problem.
Sudden increases in latency between two consecutive hops are often a sign of a bottleneck. This could be due to overloaded routers, inefficient routing, or network congestion.
By carefully analyzing latency patterns, you can pinpoint where delays are occurring and take appropriate action.
Dealing with Missing Responses and Asterisks
In some cases, traceroute output will include asterisks instead of response times. This indicates that no response was received for that particular probe within the expected time frame.
There are several reasons why this might happen. The most common is that the router is configured not to respond to traceroute requests. This is often done for security or performance reasons.
Another possibility is that a firewall is blocking the packets or the responses. In such cases, traceroute cannot obtain information from that hop, resulting in missing data.
It is important not to assume that missing responses always indicate a problem. If subsequent hops respond normally and the destination is reached, the lack of response from a particular hop may simply be due to configuration settings.
However, if multiple consecutive hops show no response and the trace does not reach the destination, this could indicate a connectivity issue that needs further investigation.
Using Command Options to Customize Traceroute
Traceroute includes a variety of options that allow you to modify its behavior and gather more specific information. These options can be extremely useful when dealing with complex network environments.
One commonly used option is disabling hostname resolution. By default, traceroute attempts to resolve IP addresses into hostnames, which can slow down the process. Disabling this feature speeds up execution and provides cleaner output.
Another useful option is adjusting the timeout value. This determines how long traceroute waits for a response before moving on to the next probe. Increasing the timeout can help in networks with high latency, while decreasing it can make the command run faster in stable environments.
Limiting the maximum number of hops is also helpful. This prevents traceroute from probing unnecessarily long paths and keeps the output manageable.
Traceroute can also be configured to use different protocols. Switching from UDP to TCP or ICMP can help bypass network restrictions and provide more accurate results in certain scenarios.
Increasing the number of probes per hop can improve accuracy, especially in networks with variable performance. By sending more probes, you can obtain a better average response time and identify inconsistencies.
Identifying Network Bottlenecks
One of the primary uses of traceroute is identifying bottlenecks in a network. A bottleneck occurs when a particular segment of the network slows down traffic, resulting in increased latency.
By examining traceroute output, you can identify where response times begin to increase significantly. This often indicates the location of the bottleneck.
For example, if the first few hops have low latency and a sudden spike occurs at a later hop, the issue is likely located at or beyond that point. This information is valuable for troubleshooting and can help you focus your efforts on the problematic area.
It is also useful when communicating with network providers. By providing traceroute results, you can show exactly where the issue is occurring, making it easier to resolve.
Detecting Routing Problems
Traceroute is also effective for identifying routing issues. Routing problems can occur when data takes an inefficient path or gets caught in loops.
A routing loop occurs when packets are repeatedly sent between the same routers without reaching the destination. In traceroute output, this appears as repeating hop entries.
Another issue is suboptimal routing, where data takes a longer path than necessary. This can result in higher latency and reduced performance.
Traceroute helps detect these issues by showing the exact path taken by packets. By analyzing this path, you can determine whether routing is functioning correctly or needs adjustment.
Verifying Connectivity and Reachability
Traceroute is commonly used to verify whether a destination is reachable. If the trace successfully reaches the destination, it confirms that there is a valid path between the source and the target.
If the trace fails before reaching the destination, it indicates that there may be a connectivity issue. This could be due to network failures, misconfigured routes, or firewall restrictions.
In such cases, traceroute provides valuable clues about where the problem is occurring. By identifying the last responding hop, you can narrow down the location of the issue.
This information is especially useful when troubleshooting connectivity problems in large or complex networks.
Real World Use Cases of Traceroute
Traceroute is widely used in various real-world scenarios. One common use case is diagnosing slow internet connections. By tracing the route to a website, you can determine whether the delay is caused by your local network or an external factor.
Another use case is troubleshooting server connectivity issues. If a server is unreachable, traceroute can help identify where the connection is failing. It does this by showing the last responding hop before the packets stop progressing toward the destination
This information allows you to narrow down whether the issue exists within your local network, your internet service provider, or the remote server’s network. In many cases, this helps reduce troubleshooting time by pointing directly to the problem area. It also makes it easier to communicate with support teams, since you can provide clear evidence of where the failure occurs along the network path.
Network administrators also use traceroute to monitor network performance and detect changes in routing behavior. By running traceroute regularly, they can establish a baseline and quickly identify anomalies.
Traceroute is also useful for verifying network configurations. For example, after making changes to routing tables or firewall rules, you can use traceroute to confirm that traffic is flowing as expected.
Comparing Traceroute with Other Tools
While traceroute is powerful, it is often used alongside other tools for a more comprehensive analysis. One such tool is ping, which measures basic connectivity and latency.
Ping provides a quick way to check whether a host is reachable, but it does not show the path taken by packets. Traceroute complements ping by providing detailed route information.
Another related tool is tracepath, which is similar to traceroute but uses a slightly different approach. It is often used for simpler diagnostics and does not require special permissions.
By combining these tools, you can gain a more complete understanding of network behavior and diagnose issues more effectively.
Common Mistakes When Interpreting Results
Interpreting traceroute output requires careful analysis. One common mistake is assuming that high latency at a single hop always indicates a problem. In reality, some routers deprioritize traceroute responses, resulting in higher response times that do not affect actual traffic.
Another mistake is misinterpreting missing responses as failures. As mentioned earlier, some routers are configured not to respond, which can lead to misleading conclusions.
It is also important to consider the overall pattern rather than focusing on individual values. Consistency and trends are more meaningful than isolated data points.
By avoiding these common mistakes, you can make more accurate assessments and use traceroute more effectively.
Introduction to Advanced Traceroute Usage
After learning the fundamentals of traceroute and how to interpret its output, the next step is to explore more advanced techniques that can enhance its effectiveness. While basic usage is sufficient for simple diagnostics, complex network environments often require deeper analysis and more refined approaches.
Advanced traceroute usage involves modifying how probes are sent, analyzing protocol behavior, and combining traceroute with other diagnostic methods. These techniques allow users to uncover hidden issues, bypass restrictions, and gain a more accurate understanding of network performance.
In real-world scenarios, networks are rarely straightforward. They often include firewalls, load balancers, multiple routing paths, and various configurations that can affect how traceroute behaves. Understanding these complexities is essential for using traceroute effectively in professional environments.
Using Different Protocols for Deeper Analysis
Traceroute typically uses UDP packets by default, but this is not always the best choice in every situation. Some networks block or filter UDP traffic, which can lead to incomplete or misleading results. To overcome this limitation, traceroute allows the use of alternative protocols such as ICMP and TCP.
Using ICMP can be helpful when diagnosing general connectivity issues, as it behaves similarly to the ping command. It is often more likely to receive responses from routers that ignore UDP probes.
TCP-based traceroute is particularly useful when testing connectivity to specific services. For example, if you want to verify whether a web server is reachable, using TCP with the appropriate port can provide more relevant results. This approach is also effective in environments where firewalls allow TCP traffic but block other protocols.
Switching between protocols allows you to compare results and identify inconsistencies. If one protocol shows a complete path while another does not, it may indicate filtering or blocking at certain points in the network.
Port Specific Troubleshooting
In many cases, network issues are related to specific services rather than general connectivity. For example, a server might respond to ping requests but fail to load a website. This could indicate that a particular port is blocked or misconfigured.
Traceroute can be used to test specific ports by combining it with TCP mode. By targeting a particular port, you can determine whether traffic is being allowed through the network.
This technique is especially useful for diagnosing firewall rules and access control lists. If traceroute fails when targeting a specific port but succeeds with another, it suggests that the issue is related to port restrictions.
Port-specific testing provides a more detailed view of network behavior and helps isolate problems that would not be visible with standard traceroute usage.
Increasing Accuracy with Multiple Probes
By default, traceroute sends a limited number of probes to each hop. While this is usually sufficient, increasing the number of probes can provide more accurate results in unstable or high-latency networks.
Sending more probes allows you to observe variations in response times and identify patterns that might otherwise go unnoticed. This is particularly useful in networks with fluctuating performance or intermittent issues.
For example, if one probe shows a high response time but others are normal, it may indicate a temporary delay rather than a consistent problem. On the other hand, if all probes show high latency, it is more likely that there is a genuine issue at that hop.
Adjusting the number of probes helps improve the reliability of your analysis and reduces the chances of misinterpreting the data.
Detecting Load Balancing Behavior
Modern networks often use load balancing to distribute traffic across multiple paths. While this improves performance and reliability, it can also complicate traceroute results.
In a load-balanced network, packets sent by traceroute may take different paths, resulting in varying hop sequences. This can make the output appear inconsistent or confusing.
To better understand load balancing behavior, you can run traceroute multiple times and compare the results. If different paths are observed, it indicates that load balancing is in effect.
Some traceroute implementations also provide options to maintain consistent flow identifiers, which can help produce more stable results. Understanding how load balancing affects traceroute is important for accurate interpretation.
Identifying MTU and Fragmentation Issues
Maximum Transmission Unit, or MTU, refers to the largest size of a packet that can be transmitted without fragmentation. Incorrect MTU settings can lead to performance issues, packet loss, or connectivity problems.
Traceroute can assist in identifying MTU-related issues by adjusting the size of the packets it sends. By gradually reducing the packet size and observing where fragmentation occurs, you can determine the optimal MTU for a network path.
This technique is often used in combination with other tools, but traceroute provides valuable insights into where packet size limitations exist. Identifying these limitations can help improve network efficiency and prevent data transmission issues.
Troubleshooting High Latency
High latency is one of the most common network problems, and traceroute is an effective tool for identifying its source. By examining response times at each hop, you can determine where delays are occurring.
When analyzing latency, it is important to look for consistent patterns rather than isolated spikes. A sudden increase in latency that persists across subsequent hops usually indicates a problem at that point in the network.
Possible causes of high latency include network congestion, overloaded routers, long physical distances, or inefficient routing. By identifying the location of the delay, you can take targeted action to resolve the issue.
In some cases, high latency may be beyond your control, such as when it occurs within an external network. However, having this information allows you to communicate more effectively with service providers.
Diagnosing Packet Loss and Connectivity Failures
Traceroute is also useful for detecting packet loss and connectivity failures. Packet loss occurs when data packets fail to reach their destination, which can result in slow performance or dropped connections.
If traceroute shows missing responses or fails to reach the destination, it may indicate packet loss. However, it is important to differentiate between actual packet loss and intentional filtering by network devices.
Consistent lack of responses across multiple hops is more likely to indicate a genuine connectivity issue. In contrast, isolated missing responses may simply be due to routers not replying to traceroute probes.
By carefully analyzing the output, you can determine whether packet loss is occurring and identify its likely cause.
Combining Traceroute with Other Tools
While traceroute is powerful on its own, it becomes even more effective when used in combination with other network diagnostic tools. Each tool provides a different perspective, and together they offer a more complete picture.
Ping is often used alongside traceroute to measure basic connectivity and latency. While ping does not show the path taken by packets, it provides a quick way to verify whether a host is reachable.
Other tools can provide additional insights into network performance, routing tables, and traffic patterns. By combining these tools, you can perform more comprehensive diagnostics and identify issues more accurately.
Using multiple tools also helps validate your findings. If traceroute indicates a problem at a certain hop, you can use other methods to confirm whether the issue is real.
Best Practices for Effective Traceroute Usage
To get the most out of traceroute, it is important to follow best practices. These practices help ensure accurate results and reduce the likelihood of misinterpretation.
One of the most important practices is establishing a baseline. By running traceroute under normal conditions, you can understand what typical network behavior looks like. This makes it easier to identify anomalies when problems occur.
Running traceroute multiple times is also recommended. Network conditions can change rapidly, and a single test may not provide a complete picture. Repeated tests help confirm findings and identify consistent patterns.
It is also important to be aware of network policies and configurations. Some networks intentionally block or limit traceroute traffic, which can affect the results. Understanding these factors helps avoid incorrect conclusions.
Another best practice is documenting your findings. Keeping records of traceroute results can be useful for future reference and for communicating with other team members or service providers.
Understanding Limitations in Advanced Scenarios
Even with advanced techniques, traceroute has limitations that must be considered. In complex networks, factors such as load balancing, traffic prioritization, and security measures can affect the accuracy of results.
Some routers may respond slowly or not at all to traceroute probes, even though they are functioning correctly. This can create the appearance of a problem where none exists.
Additionally, traceroute only shows the path taken by probe packets, which may not always match the path taken by actual application traffic. Differences in protocol or routing policies can lead to variations.
Being aware of these limitations is essential for making informed decisions based on traceroute data.
Practical Examples of Advanced Troubleshooting
In real-world environments, traceroute is often used to solve complex issues. For example, a company experiencing slow access to a cloud service might use traceroute to identify where delays are occurring. By analyzing the results, they can determine whether the issue is within their own network or with the service provider.
Another example involves diagnosing firewall restrictions. If a service is inaccessible, traceroute with TCP can help identify whether a specific port is being blocked.
Traceroute is also useful for monitoring network changes. By comparing results over time, administrators can detect shifts in routing behavior and address potential problems before they escalate.
These practical applications demonstrate the versatility and importance of traceroute in network management.
Conclusion
Traceroute is one of the most valuable tools available for network diagnostics in Linux. From basic path discovery to advanced troubleshooting techniques, it provides deep insight into how data travels across networks.
By mastering traceroute, you gain the ability to identify latency issues, detect routing problems, and diagnose connectivity failures with precision. Its flexibility in using different protocols and customization options makes it suitable for a wide range of scenarios.
However, effective use of traceroute requires more than just running the command. It involves careful analysis, understanding of network behavior, and awareness of its limitations. When combined with other tools and best practices, traceroute becomes an essential part of any troubleshooting process.
In today’s complex networking environments, having the ability to quickly and accurately diagnose issues is crucial. Traceroute empowers users with the knowledge needed to understand network paths and resolve problems efficiently, making it an indispensable skill for anyone working with Linux systems and networks.
Continue exploring the technologies and certification concepts that matter most to you.